With the recently released Red Hat Enterprise Linux (RHEL) 9.6 and 10, a new functionality becomes available: pcp xsos. Performance Co-Pilot (PCP) has been part of RHEL for a long time.
PCP xsos can provide a convenient system overview:
- Of the currently running system.
- And of other systems, based on their PCP archive files.
Pcp xsos was created to improve our ability to debug customer issues more effectively. In Red Hat support, this starts with reviewing SOS reports that contain pieces from many corners of the customer's system. When PCP was running and configured to record the system's metrics, then the SOS report contains the most recent archive files, allowing us to run “pcp xsos” and obtain a system overview.
Basic pcp xsos usage
Let’s start with the live system. We will install the package pcp-zeroconf, which pulls in essential PCP dependencies, configures the services and starts the pmcd daemon.
# dnf -y install pcp-zeroconf pcp-system-tools
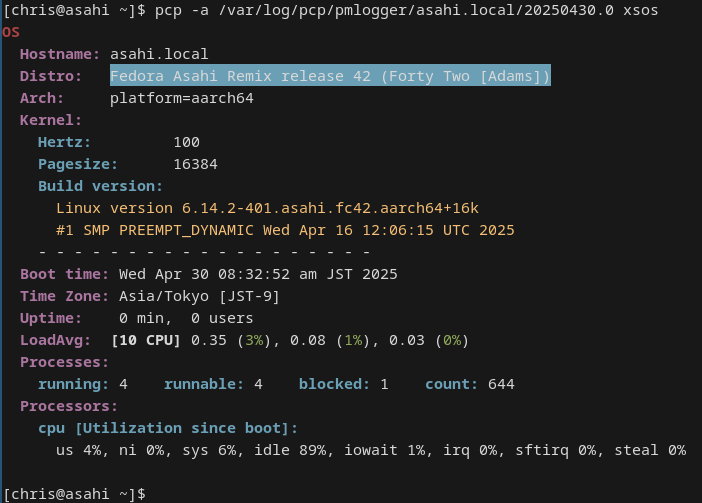
This provides us with an overview of the running system:

Under the hood, this command is contacting the pmcd daemon and composing the overview for us. Instead of using metrics from the running pmcd, we receive the output based on PCP archive files:
PCP archives are portable, allowing users to cross architectures. For example, they allow us to use an x86-64 system to analyze archive files from aarch64 or s390x systems. Without pcp xsos, we would have to dig in various places of the sos report to obtain this overview.
When we installed the package pcp-zeroconf, the pmlogger service was enabled and configured with detailed settings to create a historical record of metrics. The archive files are available below /var/log/pcp/pmlogger/<systemname>.
The pcp xsos functionality is part of the pcp-system-tools package, which is available on RHEL 9.6, RHEL 10 and Fedora. However, pcp xsos is designed for flexibility and can analyze performance data collected from older RHEL versions as well, such as RHEL 7 or RHEL 8. As long as the PCP archive files from the older systems contain the necessary performance metrics, pcp xsos can process them and provide the system overview.
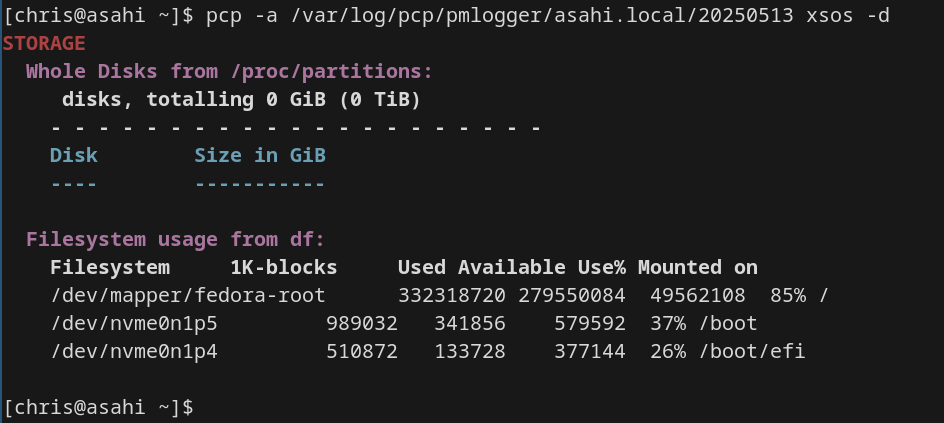
Using the -d parameter, we can also obtain storage details:
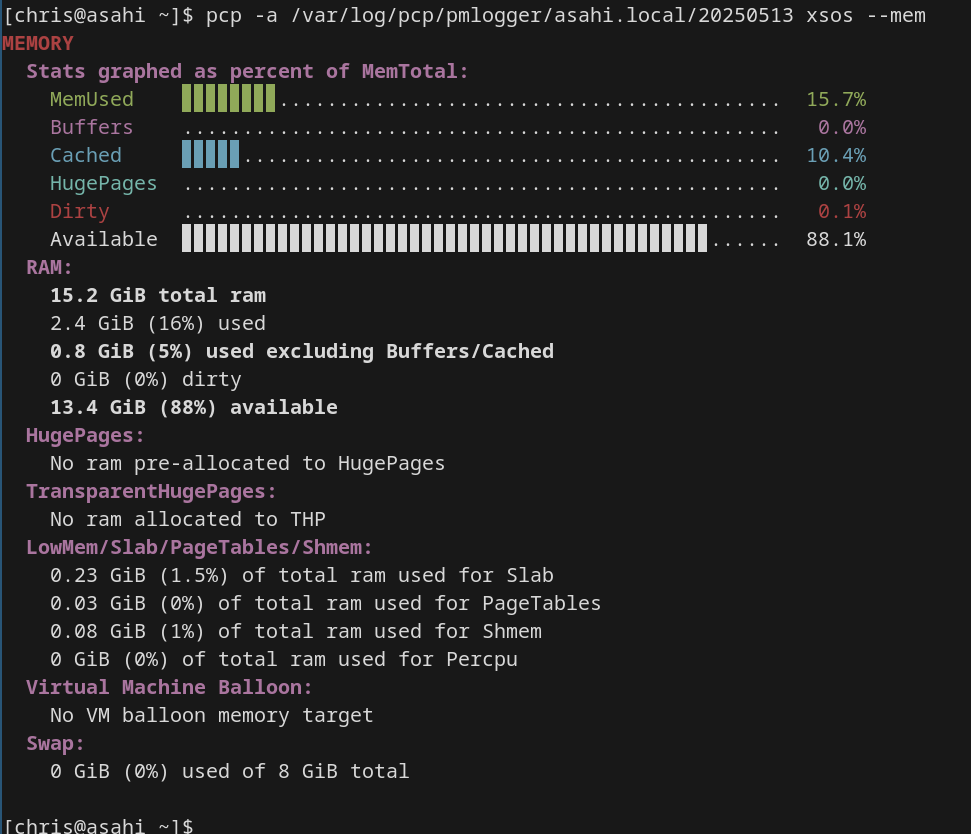
Also, using -mem, we can obtain memory details:
Further options for pcp xsos include:
- Network interface statistics like interface errors via ‘--netdev’
- Generic netstats via ‘--netstat’
- Process statistics via ‘-p’
Conclusion
The pcp xsos functionality on RHEL is a powerful tool for administrators and engineers to better support customers’ debugging issues.
- The upstream repo is at https://github.com/performancecopilot/xsos-pcp.
- The Red Hat product documentation has many details on PCP.
- Read the article: How to solve performance mysteries with Performance Co-Pilot on Red Hat Enterprise Linux
product trial
红帽企业 Linux 服务器版 | 60 天免费试用
关于作者

Christian Horn is a Senior Technical Account Manager at Red Hat. After working with customers and partners since 2011 at Red Hat Germany, he moved to Japan, focusing on mission critical environments. Virtualization, debugging, performance monitoring and tuning are among the returning topics of his daily work. He also enjoys diving into new technical topics, and sharing the findings via documentation, presentations or articles.

Nathan is an engineer in Red Hat's Platform Tools group, leading the Grafana and PCP team.


