What is the cluster observability operator?
Defining cluster observability operators
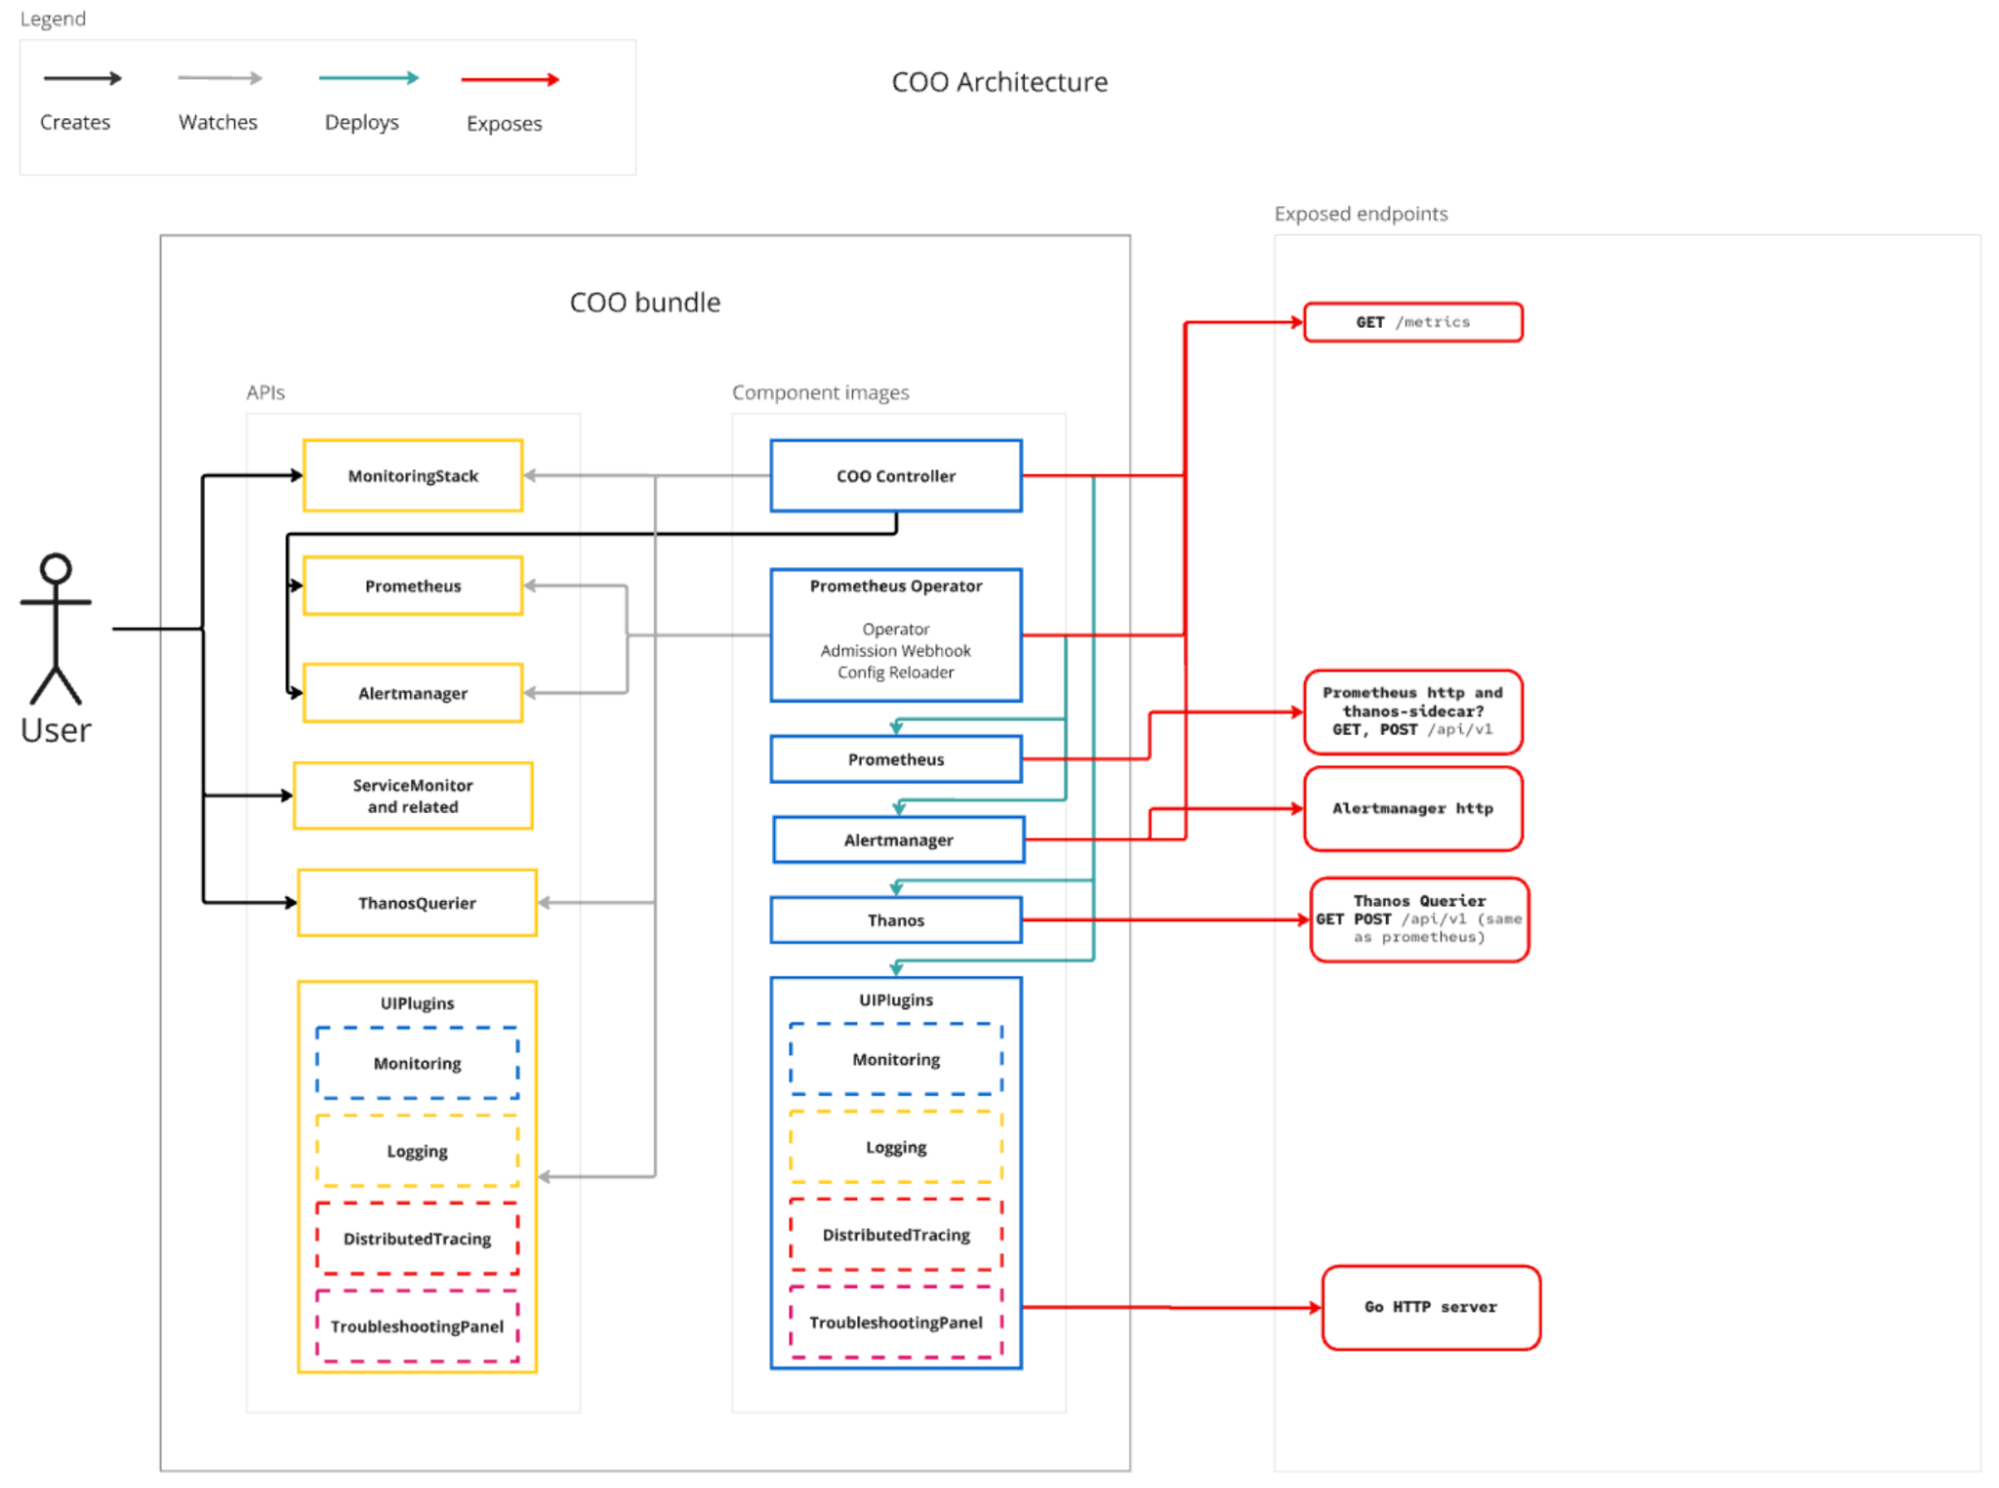
Cluster observability is a single entry point optional operator for (1) creating standalone monitoring stacks independent from the default in-cluster monitoring one, and for (2) deploying observability visualization and analytics components for Red Hat OpenShift and Red Hat Advanced Cluster Management for Kubernetes. It’s based on its upstream counterpart, observability operator. With the 1.0.0 release, we are glad to announce that the cluster observability operator becomes generally available, powered by Konflux. An overview of its current architecture is provided in Figure 1.
Why install the cluster observability operator?
With this overview in mind, why should you consider installing the cluster observability operator? Let’s break down its features:
- Create standalone monitoring stacks. Deploy it to create standalone monitoring stacks that are independently configurable for use by different services and users—independent from the default in-cluster monitoring stack—the two stacks do not conflict
- Make use of observability visualization capabilities as part of Red Hat OpenShift web console: dashboards user interface (UI) plug-in, troubleshooting UI plug-in, distributed tracing UI plug-in, logging UI plug-in and monitoring UI plug-in
- Benefit from Observability Signal Correlation and additional analytics tools - provided as part of UI features
With this in mind, let’s take a look at each of those features separately. Starting with monitoring, what are the benefits of deploying the cluster observability operator for creating standalone monitoring stacks?
- Extendability: Add more metrics
- Multitenancy support: Deploy multiple stacks per namespace or a single stack for multiple namespaces
- Scalability: Create cluster observability operator-managed monitoring stacks as needed
- Flexibility: Cluster observability releases decoupled from Red Hat OpenShift release cycle
- Highly customizable: The cluster observability operator can delegate ownership of single configurable fields in custom resources
Additionally, what are the advantages of installing the cluster observability operator for analytics purposes?
- It allows Red Hat OpenShift users to benefit from observability signal correlation—powered by Korrel8r (now available as an enhanced technology preview)
- In the future, we plan to provide the cluster observability operator with additional analytics capabilities, including incident detection, which will soon be accessible by users in a dedicated incidents tab in the Red Hat OpenShift web console
Note: Analytics features deployed by the cluster observability operator are always tied to observability UI plug-ins.
Another benefit of installing the cluster observability operator is making use of the existing observability UI plug-ins, which include:
- Troubleshooting UI plug-in: Alerts and metrics are always available by default in an OpenShift cluster. Other signal types require optional components to be installed
- Dashboards UI plug-in: You can add other Prometheus data sources from the cluster to the default dashboards, in addition to the in-cluster data source
- Logging UI plug-in: You need to have a LokiStack instance in your cluster
- Distributed tracing UI plug-in: You need to select a supported TempoStack or TempoMonolithic multitenant instance running in the cluster
The monitoring UI plug-in is also included in the cluster observability operator 1.0.0, allowing Red Hat Advanced Cluster Management customers to make use of a brand new observe>alerting UI directly in the Red Hat Advanced Cluster Management console. This is a developer preview release, and as such, cluster observability operator is installed on the Red Hat Advanced Cluster Management hub.
Use cases
The cluster observability operator provides these benefits and capabilities:
- DevOps teams: Enables the tailoring of observability stacks for multitenant environments. It simplifies monitoring and troubleshooting because it is set up for out-of-the-box observability
- Platform engineers: Enables the monitoring of large clusters with varying workloads, reducing operational overhead
- Application observability: Reduces debugging latency in distributed systems, enabling end-to-end visibility for applications running in distributed environments
- Enterprise monitoring: Simplifies monitoring and troubleshooting by providing UI customizations via observability UI plug-ins and related analytics features
Cluster observability operator 1.0.0 - New enhancements
1. Observability signal correlation and troubleshooting plug-in for OpenShift
Observability signal correlation with its dedicated troubleshooting panel in the Red Hat OpenShift web console is available as an enhanced technology preview. The troubleshooting plug-in is powered by Korrel8r, an open source project that finds relationships between kubernetes resources and other signals from multiple heterogeneous data stores, reducing the complexity of handling different labelling conventions and query languages, and most importantly, empowering users to find the root cause of issues faster.
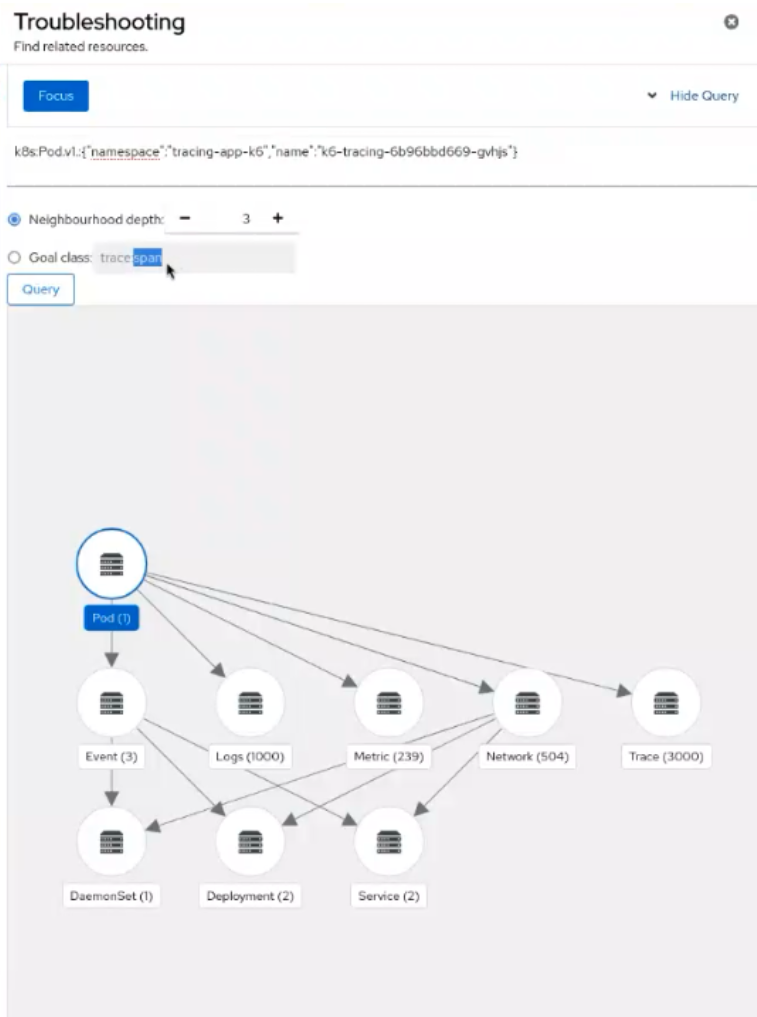
Trace support (Tempo) is the most recent enhancement of the tool that you can test by installing the cluster observability operator 1.0.0 version. For example, starting with a pod, you will be able to visualize its correlated traces (see Figure 2).
Taking advantage of experimental features in the troubleshooting panel, users can customize their own correlation experience:
- The FOCUS functionality allows users to switch the starting signal of the correlation, depending on your troubleshooting questions
- The query positioned below the FOCUS button reflects the Korrel8r query, which gets adjusted as Focus functionality is applied
- With Neighborhood depth, users can increase or decrease the depth of correlation to explore a smaller or larger neighborhood
- With goal class, users can opt for a goal-directed search instead of a neighborhood search, which is the standard default. A goal-directed search shows all available paths from the starting signal to the goal signal that users can specify (in this case, ‘traces,’ as seen in Figure 2)
2. Multicluster alerting UI for Red Hat Advanced Cluster Management
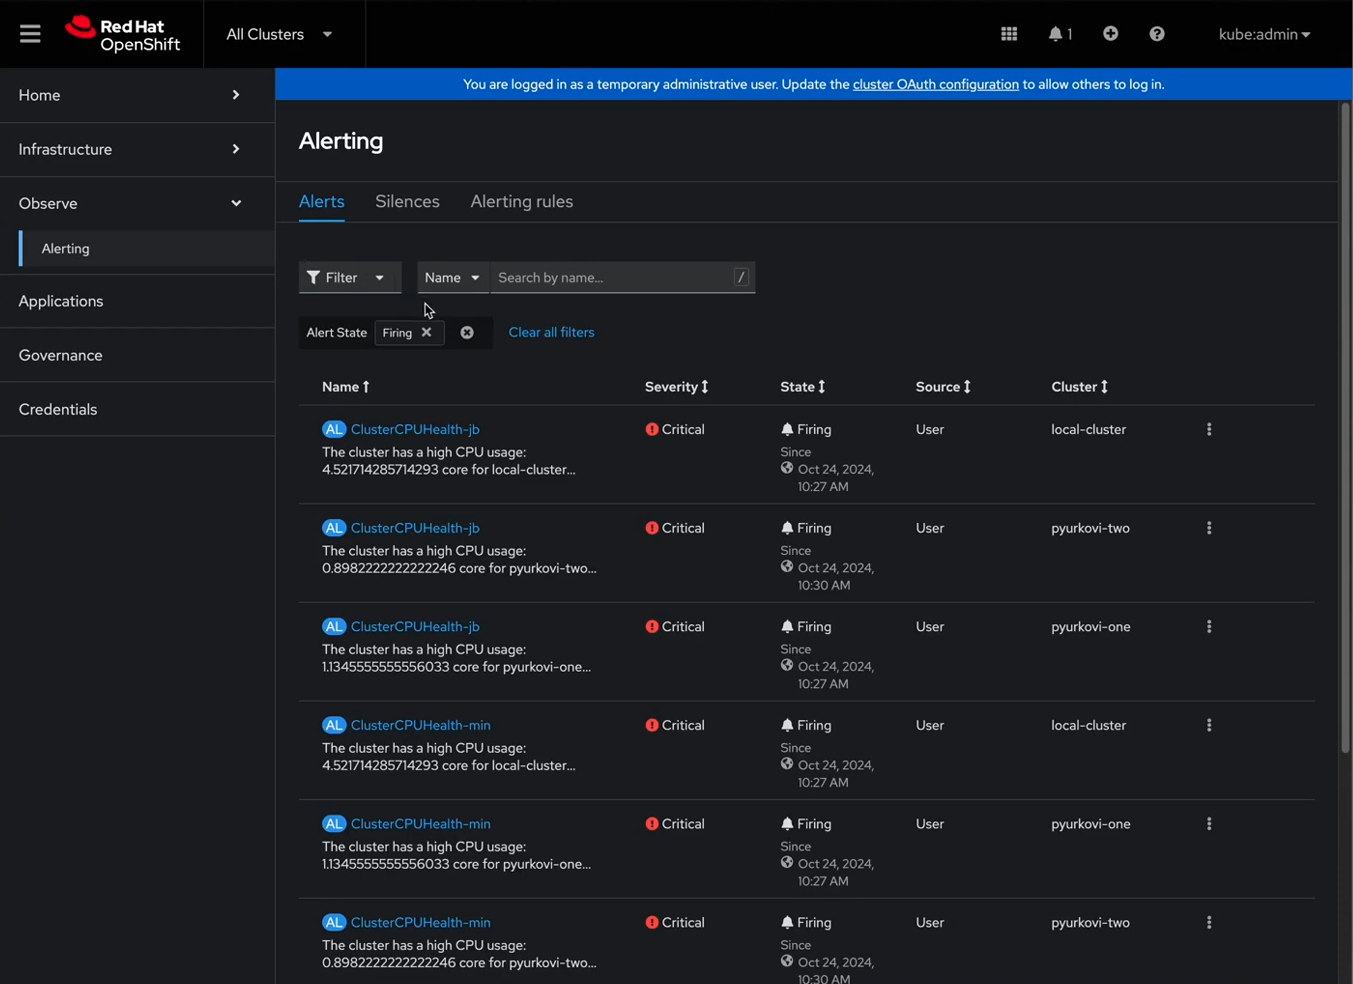
By installing cluster observability operator 1.0.0, you can test a developer preview of the multicluster alerting UI directly in the Red Hat Advanced Cluster Management console. These new capabilities improve the overall alert management experience for users, making it less error-prone. This is an innovative feature because prior to this feature, Red Hat Advanced Cluster Management users performed alert management via command-line interface (CLI). The current developer preview allows users to install the cluster observability operator on a Red Hat Advanced Cluster Management hub, searching for specific alerts and filtering warning-status alerts. Additionally, you can silence alert rules and take action directly from the console (see Figure 3).
Frequently asked questions
Is the cluster observability operator tied to Red Hat OpenShift releases?
Because cluster observability operator is an optional operator, it is not tied to Red Hat OpenShift release cycles.
Note: Cluster observability operator has only one supported release and version (the latest one) to avoid releasing unsupported versions.
Is the cluster observability operator a centralized operator?
The cluster observability operator currently behaves like a meta-operator, with most of its components individualistic, rather than integrated with one another and centralized.
Each of the observability UI plug-ins has a different way of retrieving its data sources, specifically with:
- Monitoring UI plug-in (with the multicluster alerting UI in Red Hat Advanced Cluster Management) receives any Thanos Querier and Alertmanager URL and port and then connects to them
- Logging UI plug-in receives any Loki stacks in the OpenShift Container Platform-logging namespace
- Distributed tracing UI plug-in retrieves a list of all Tempo stacks available and then allows users to select them from a dropdown menu
- Troubleshooting UI plug-in creates and connects to its own Korrel8r. This means that no configuration is available
How does the cluster observability operator work in Red Hat Advanced Cluster Management?
Starting with Red Hat Advanced Cluster Management 2.14, the cluster observability operator will be installed by default as part of the multicluster observability operator as a developer preview feature. This means that Red Hat Advanced Cluster Management users will not be required to install the operator to use the observability UI plug-in and related analytics features.
Are there any resources or blogs focusing on the cluster observability operator?
The following blogs that focus on monitoring provide additional information:
- Brief overview of the cluster observability operator
- Step-by-step guide to configuring alerts in the cluster observability operator
Are there any plans to evolve the cluster observability operator?
There are plans to evolve the cluster observability operator, including additional analytics features and customizable dashboards tied to observability UI plug-ins. The next release (the cluster observability operator 1.1) is already in the works and will soon be available with some exciting components.
Wrap up
Ready to explore the cluster observability operator’s new features? Visit the documentation pages to learn more and get started.
We value your feedback! Share your thoughts and suggestions using the Red Hat OpenShift feedback form.
product trial
Red Hat OpenShift Data Foundation | Testversion
Über die Autoren

Vanessa is a Senior Product Manager in the Observability group at Red Hat, focusing on both OpenShift Analytics and Observability UI. She is particularly interested in turning observability signals into answers. She loves to combine her passions: data and languages.

Roger Florén, a dynamic and forward-thinking leader, currently serves as the Principal Product Manager at Red Hat, specializing in Observability. His journey in the tech industry is marked by high performance and ambition, transitioning from a senior developer role to a principal product manager. With a strong foundation in technical skills, Roger is constantly driven by curiosity and innovation. At Red Hat, Roger leads the Observability platform team, working closely with in-cluster monitoring teams and contributing to the development of products like Prometheus, AlertManager, Thanos and Observatorium. His expertise extends to coaching, product strategy, interpersonal skills, technical design, IT strategy and agile project management.
Mehr davon
Nach Thema durchsuchen

Automatisierung
Das Neueste zum Thema IT-Automatisierung für Technologien, Teams und Umgebungen

Künstliche Intelligenz
Erfahren Sie das Neueste von den Plattformen, die es Kunden ermöglichen, KI-Workloads beliebig auszuführen

Open Hybrid Cloud
Erfahren Sie, wie wir eine flexiblere Zukunft mit Hybrid Clouds schaffen.

Sicherheit
Erfahren Sie, wie wir Risiken in verschiedenen Umgebungen und Technologien reduzieren

Edge Computing
Erfahren Sie das Neueste von den Plattformen, die die Operations am Edge vereinfachen

Infrastruktur
Erfahren Sie das Neueste von der weltweit führenden Linux-Plattform für Unternehmen

Anwendungen
Entdecken Sie unsere Lösungen für komplexe Herausforderungen bei Anwendungen
Virtualisierung
Erfahren Sie das Neueste über die Virtualisierung von Workloads in Cloud- oder On-Premise-Umgebungen